
Alternative Mismatch Indicators
We propose several additional indicators to characterize the time curve arbitrage carried out by the financial system. This mismatch is the main cause of inefficiency in the allocation of productive resources provided by financial intermediaries.
The first one is the mismatch indicator. It is formed by the sum of the points in which the slope of the yield curve is negative, i.e., the sum of all terms in which there is a greater interest in a shorter period. We used data from the European Central Bank, with monthly deficiency and monthly performance up to ten years
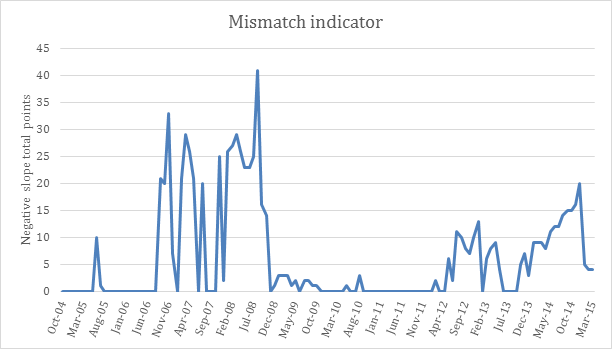
Source: Original arrangement compiled from ECB data.
We also propose using the long- vs short-term spread. This indicator analyzes the difference in spread between a risk-free bond at three months and its analogue at three years. The tension caused by liquidity struggles is reflected here. When the indicator is close to zero or becomes negative, we expect a crisis in the short term.
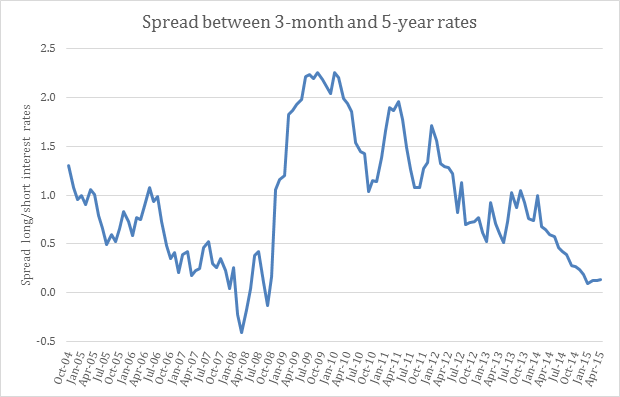
Source: Original arrangement compiled from ECB data.
Finally, we propose calculating the slope of the yield curve, taking into account the entire yield curve, not just two isolated points. Similarly, when it approaches zero, a crisis is imminent.
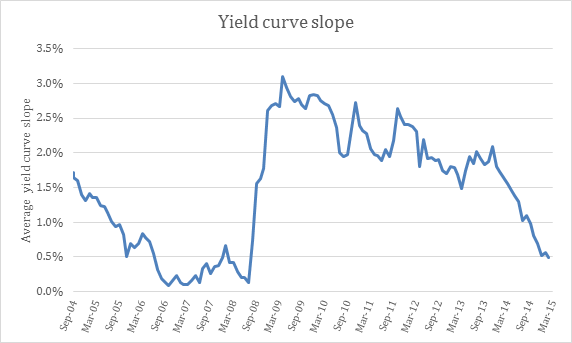
Source: Original arrangement compiled from ECB data.